
Muni’s Equity Toolkit Helps Essential Employees Get to Work

Muni’s Equity Toolkit Helps Essential Employees Get to Work
By Mariana Maguire

The latest data from SFMTA’s new Equity Toolkit shows that Muni service changes are helping people in neighborhoods identified by our Muni Service Equity Strategy access more jobs and support the city’s recovery.  

In winter 2020, we launched the SFMTA Equity Toolkit to understand how service decisions are affecting neighborhoods where there is likely a high prevalence of essential workers who rely predominantly on Muni to get to their essential jobs. Our goal is to make better service decisions based on the trends and impacts we see in the Equity Toolkit.  

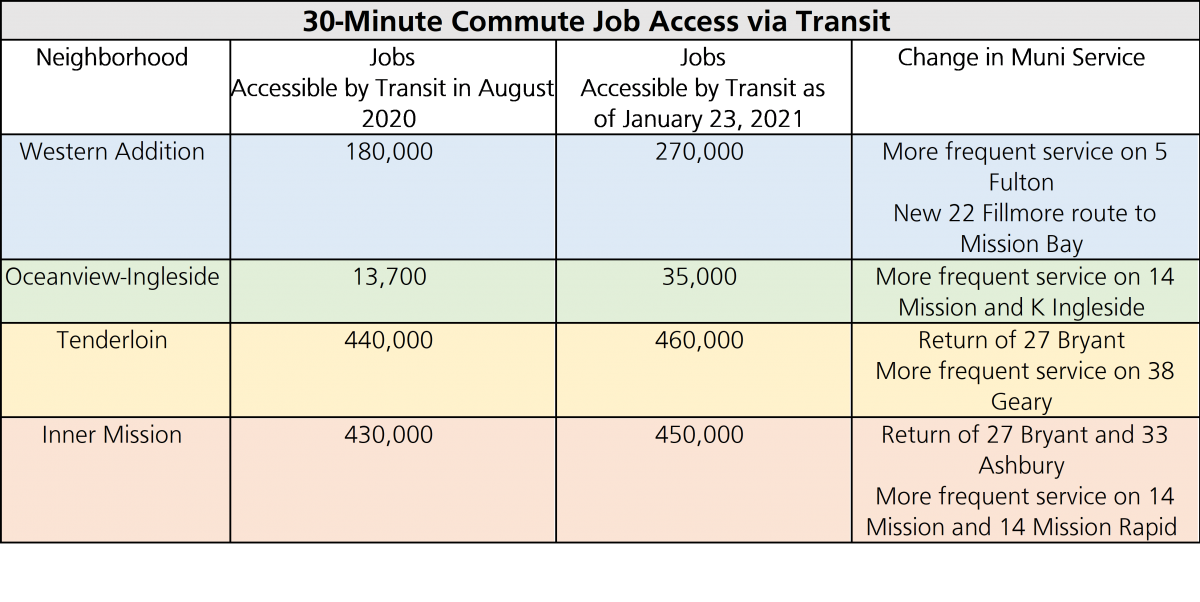
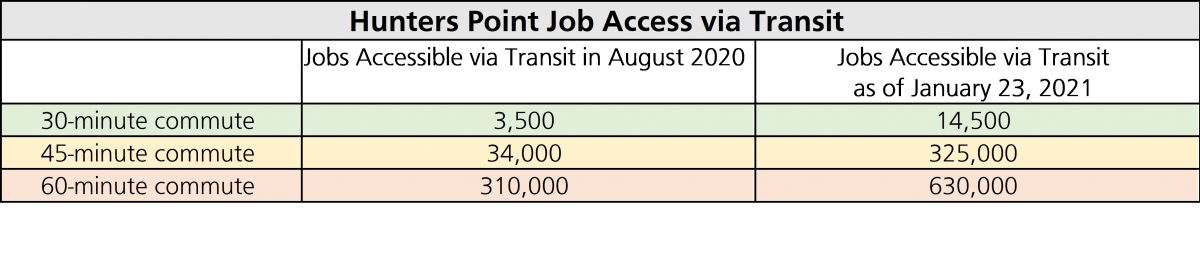
Recently, the greatest increases in access to jobs via Muni have been in Hunters Point and Western Addition. The Hunters Point neighborhood saw the largest gains from the addition of the 15 Bayview-Hunters Point Express, as demonstrated in the table below. Thanks to the return of key Muni lines and increased frequencies on connector routes, Inner Mission, Tenderloin, Oceanview-Ingleside and Treasure Island have also seen increased access to jobs via Muni.  

Table title: "30-Minute Commute Job Access via Transit" First row, left to right: column 1 is "Neighborhood", column 2 is "Jobs Accessible by Transit in August 2020", column 3 is "Jobs Accessible by Transit as of January 23, 2021", column 4 is "Change in Muni Service" Second row, left to right: column 1 is "Western Addition", column 2 is "180,000", column 3 is "270,000", column 4 is "More frequent service on 5 Fulton, New 22 Fillmore route to Mission Bay" Third row, left to right: column 1 is "Oceanview-Ingleside", column 2 is "13,700", column 3 is "35,000", column 4 is "More frequent service on 14 Mission and K Ingleside" Fourth row, left to right: column 1 is "Tenderloin", column 2 is "440,000", column 3 is "460,000", column 4 is "Return of 27 Bryant, More frequent service on 38 Geary" Fifth row, left to right: column 1 is "Inner Mission" column 2 is "430,000", column 3 is "450,000", column 4 is "Return of 27 Bryant and 33 Ashbury, More frequent service on 14 Mission and 14 Mission Rapid"

Table title: Hunters Point Job Access via Transit First row, left to right: column 1 is blank, column 2 is "Jobs Accessible via Transit in August 2020", column 3 is "Jobs Accessible via Transit as of January 23, 2021" Second row, left to right: column 1 is "30-minute commute", column 2 is "3,500", column 3 is "14,50o" Third row, left to right: column 1 is "45-minute commute", column 2 is "34,000", column 3 is "325,000" Fourth row, left to right: column 1 is "60-minute commute", column 2 is "310,000", column 3 is "630,000"

Lessons Learned 

The Equity Toolkit also shows some decreases in job access via transit in other neighborhoods identified by the Muni Service Equity Strategy. This reflects the Toolkit’s methodology and/or the impacts of service changes and helps us to understand where we need to make improvements in our data collection, transit service or both. 

Bayview job access increased for commutes of 45 and 60-minutes, but decreased 11% for 30-minute commutes. How can that be? The answer is that the T Third bus substitution was replaced with rail service in December 2020, which makes different and fewer stops than the bus within a 30-minute time period. Overall, Bayview residents are still able to access more jobs now than in August 2020 – roughly 644,500 now compared to 624,000 then, a 3% increase. 

In addition, we rely on fixed points of reference, such as the Bayview Opera House, to gather data and Bayview is a large neighborhood. We learned that using one community landmark for this area is not enough, so we will be adding additional landmarks in future analyses to more accurately capture service change impacts. 

In Visitacion Valley we see decreases in job access via transit across the board. Like in the Bayview, we determined that the issue is both methodology and service. When we redistributed buses from the 8 Bayshore to 8AX to respond to changes in ridership, the community landmark (John King Senior Community) we were using to track the data only showed us the decrease from the 8 Bayshore, not the increase from the 8AX. 

By comparison, more affluent areas show very low to no increases in job access via transit. This reflects our decision to prioritize resources on Muni service for essential workers and essential travel, especially for communities with the fewest options during this unprecedented pandemic. More affluent neighborhoods have more transportation alternatives readily available and more people who are able to work from home. 

These findings give us insights we didn’t have before and help us think about service in new ways. As we learn from the Equity Toolkit we will continue to refine it and make it more detailed by adding more reference points for our data analysis.  

As San Francisco gradually reopens and we continue to add back Muni service, we will also continue to evaluate the impacts through our Equity Toolkit and work to use these insights to inform service adjustments that support our city’s economic recovery. 

Read more about changes to our network on the SFMTA’s Transportation Recovery Plan webpage


Published March 30, 2021 at 11:03PM
https://ift.tt/2PkupwH

Comments

Popular posts from this blog

150 Years Ago Today – The Cable Car is Born

150 Years Ago Today – The Cable Car is Born By Kelley Trahan August 2, 2023, marks the 150th anniversary of the world’s first successful cable railway, born right here in San Francisco. To celebrate the occasion, we bring you the story of Andrew Hallidie and the very first cable car company, the Clay Street Hill Railroad.  Andrew Hallidie (1834-1900) was a pioneering inventor and entrepreneur who changed urban transportation. In 1852, at the age of 18, Hallidie emigrated with his father from the United Kingdom to San Francisco during the California Gold Rush. His father, an engineer and inventor, had a wire rope patent that played a crucial role in his son's future success.   Portrait of Andrew Smith Hallidie in 1890. Inspired by his father's wire rope business, Hallidie developed a steel cable mineral mine hauling system in 1857. About a decade later, he designed a wire rope aerial tramway for transporting materials over mountainous terrain. Then, after a stint in bridg...

Shared Spaces are Here to Stay. Permit Renewals are Due January 15, 2023.

Shared Spaces are Here to Stay. Permit Renewals are Due January 15, 2023. By Anne Yalon Shared Spaces, amongst many other benefits, allows our residents and families to enjoy safe and social outdoor dining. Seen here are the the owners of Tio Chilo’s Grill and their children in the restaurant’s parklet on 24th Street in the Mission.  San Francisco’s popular Shared Spaces program allows merchants, restaurants and arts and culture organizations to use the curbside, sidewalk and other public spaces to conduct local business activities and stay afloat. What emerged as an economic lifeline during the pandemic is making San Francisco’s streets more energized, engaged and activated. Many of the Shared Spaces parklets have become central gathering places for the local community. “ Our parklet makes me feel like when I go to Mexico, where outdoor seating is everywhere. People end up joining their friends in our parklet. It is a space for our customers and our community," said Liz V...

Tenderloin Streets Transform During COVID-19

Tenderloin Streets Transform During COVID-19 By Kimberly Leung COVID-19 has disproportionately impacted people who live and work in the Tenderloin. As a result, the SFMTA has been working closely with District 6 Supervisor Matt Haney’s office, other city departments, the Tenderloin Traffic Safety Task Force and community members to address the public health issues and unique challenges in the neighborhood through innovative interventions.    The Tenderloin is home to many of our most vulnerable communities including historically marginalized groups such as people with disabilities, residents of SROs and supportive housing and limited-English proficient communities. With every single street in the Tenderloin on the city’s High Injury Network -- the 13 percent of San Francisco streets that account for 75 percent of severe traffic injury collision and fatalities -- thi...