
How People Traveled Through San Francisco in 2021

How People Traveled Through San Francisco in 2021
By Maia Moran

Earth Day is April 22 and a great time to think about changes we can make in our own lives to support the health of our planet. When it comes to climate change, one of the most meaningful actions we can take is to drive less and get around more by biking, walking and taking forms of public transportation like Muni. Transportation is the largest source of greenhouse gas emissions (GHG) in San Francisco, with personal driving accounting for 72% of the sector’s emissions. By comparison, Muni accounts for about 1% of GHG emissions in and out of the city. 

But when it comes to driving less, the San Francisco Bay Area is going in the wrong direction. Public transit use fell by 11% between 2019 and 2021 and private automobile use increased by 13%, according to the results of the 2021 Travel Decision Survey. That’s why we’ve been working so hard to make transit, walking and biking more appealing and convenient with new transit lanes, better ventilation on Muni, protected bike lanes and more. 

Travel Decision Survey 

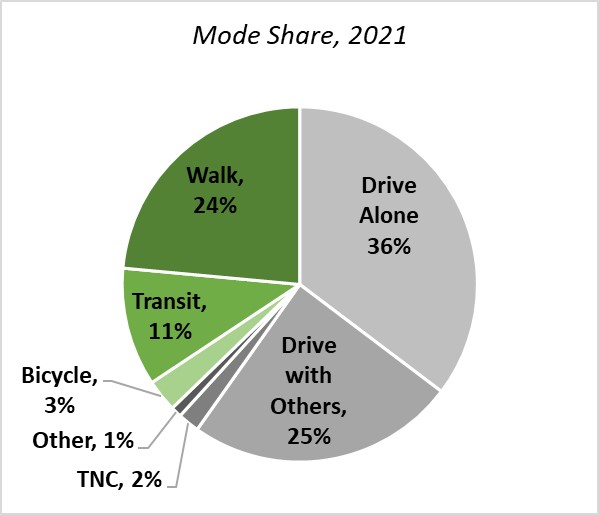
Once every two years, the SFMTA conducts a telephone survey of over 750 Bay Area residents to ask them questions about their daily travel patterns and how they get to destinations in and around San Francisco. Results from the 2021 Travel Decision Survey (TDS) indicate that the COVID-19 pandemic has driven a shift away from our vision for a transit-first city. The survey allows us to understand whether people in San Francisco are traveling by “priority” modes (walking, biking and public transit). Priority modes are those encouraged by San Francisco’s long-standing transit-first policy, which seeks to improve the city’s economy, environment and quality of life. Trips by transportation network companies (TNCs) such as Uber and Lyft, driving with others and driving alone are all categorized as “privately owned vehicle” modes and grouped into one category.  

2021 Mode Share pie chart with 7 categories, split into green and grey color shades representing the two mode-type groups. Green represents priority modes; priority mode share percentages are 24 percent walk, 11 percent transit, and 3 percent bicycle. Grey represents privately-owned vehicle modes; privately-owned vehicle mode share percentages are 36 percent drive alone, 25 percent drive with others, 2 percent Transportation Network Company, and 1 percent other.

Key Findings 

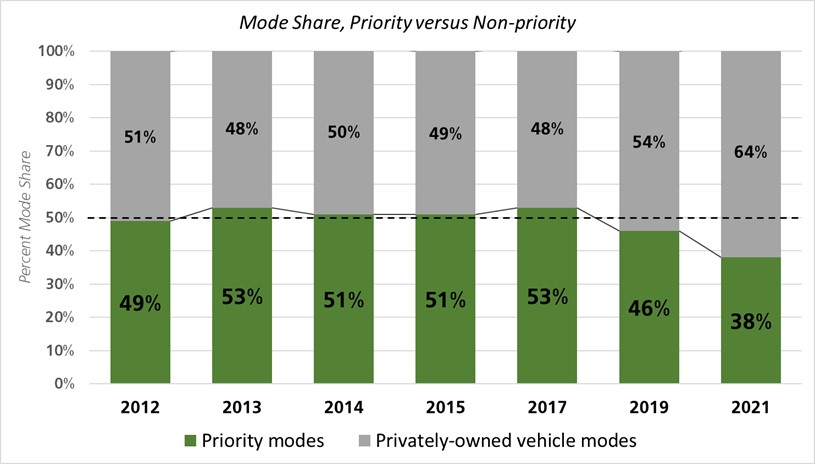
Using San Francisco County Transportation Agency data, the total number of anticipated daily trips decreased from 4.5 million in 2019 to 4.4 million in 2021, consistent with daily travel pattern shifts prompted by the pandemic such as more people working at home and fewer commuting to offices. Despite an agency goal of increasing travel by priority modes, the share for these trips fell from just under half (46%) in 2019 to just under two-fifths (38%) in 2021.  

Mode share over time bar chart grouped into priority modes and non-priority modes. Priority modes are green, non-priority modes are grey. Percent mode share in 2012 was 49 percent priority, 51 percent non-priority. Percent mode share in 2013 was 53 percent priority, 48 percent non-priority. Percent mode share in 2014 was 51 percent priority, 50 percent non-priority. Percent mode share in 2015 was 51 percent priority, 49 percent non-priority. Percent mode share in 2017 was 53 percent priority, 48 percent non-priority. Percent mode share in 2019 was 46 percent priority, 54 percent non-priority. Percent mode share in 2021 was 38 percent priority, 64 percent non-priority.

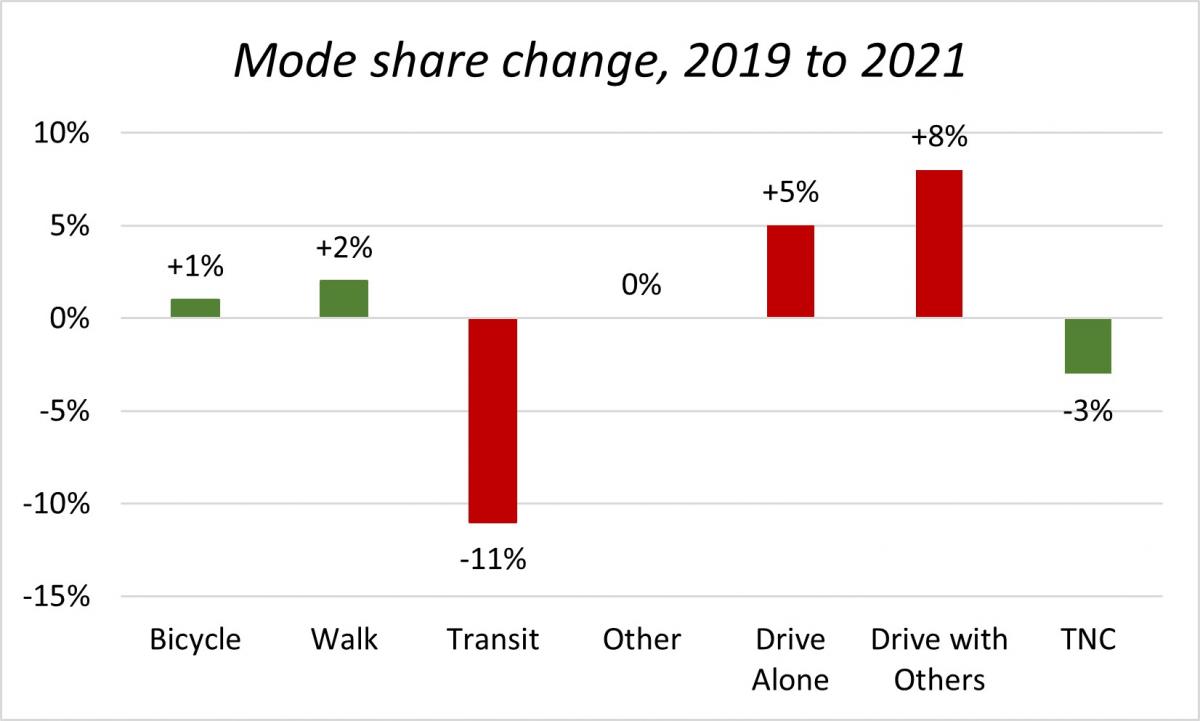
The most significant decrease in travel mode was by public transit, which fell 11% between 2019 and 2021. The most significant increase in travel mode was by private automobile use, including both driving with others (up 8%) and driving alone (up 5%). Walking and biking both had minor increases. 

Mode share change from 2019 to 2021 bar chart. Between 2019 and 2021 surveys, mode share change was 1 percent increase for bicycle, 2 percent increase for walk, 11 percent decrease for transit, 0 percent change for other, 5 percent increase for drive alone, 8 percent increase for drive with others, and 3 percent decrease for TNC.

San Francisco residents still used priority modes twice as often as non-residents for trips within San Francisco. Respondents with a household income of $75,000 or less had the highest transit ridership, while a majority of those with incomes over $75,000 chose non-priority modes. Individuals identifying as women or non-binary were more likely to travel by privately owned vehicles than those identifying as men. 

The Future of Travel 

Many of the travel pattern changes revealed by the survey were likely a result of the COVID-19 pandemic, during which many people limited their non-essential travel and worked from home instead of commuting to an office.  

Anticipated commute by mode, for pre- & mid- pandemic. Pre-pandemic, 45 percent of commuters drove alone; end of 2021, 53 percent of commuters anticipated driving alone. Pre-pandemic, 35 percent of commuters used public transit; end of 2021, 24 percent of commuters anticipated using public transit. Pre-pandemic, 9 percent of commuters drove with others; end of 2021, 11 percent of commuters anticipated driving with others. Pre-pandemic, 9 percent of commuters walked; end of 2021, 6 percent of commuters anticipated walking. Pre-pandemic,6 percent of commuters biked; end of 2021, 7 percent of commuters anticipated biking. Pre-pandemic, 3 percent of commuters used a TNC; end of 2021, 3 percent of commuters anticipated using a TNC. Pre-pandemic, 2 percent of commuters used a private shuttle; end of 2021, 2 percent of commuters anticipated using a private shuttle. Pre-pandemic, 0 percent of commuters used a scooter; end of 2021, 1 percent of commuters anticipated using a scooter.

But as the city recovers from the effects of the pandemic and travel begins to increase, we urgently need to educate Bay Area residents about how their travel decisions impact our environment. To meet San Francisco’s climate goals, including net zero emissions by the year 2040, it is critical that many of us shift from driving personal vehicles to taking public transit, walking, bicycling and using other “non-carbon” travel modes. 

To encourage that shift, the SFMTA has improved the speed and reliability of our most popular bus lines by creating an unprecedented number of transit lanes. We introduced changes to make Muni more equitable. We recently increased the staff presence on Muni vehicles to deter crime and increase safety. We also upgraded our transit fleet HVAC systems, which now turn the air over once every minute. Earlier this month, we launched the Van Ness Bus Rapid Transit Corridor, and later this year the Central Subway extension to Chinatown will be open to one and all.  

To complement transit use, we have created safe bicycling and walking routes throughout San Francisco. The city now boasts 42 miles of protected bike lanes and approximately 43 miles of Slow Streets where through traffic is limited. By lowering speed limits and completing Quick Build street improvements, we’ve made walking and bicycling safer and more comfortable.  

Now, we need to make sure people in the San Francisco Bay Area know about and take advantage of these improvements. 

The 2021 Travel Decision Survey report and results are available to download here.


Published April 19, 2022 at 08:02PM
https://ift.tt/v9gLHZ8

Comments

Popular posts from this blog

150 Years Ago Today – The Cable Car is Born

150 Years Ago Today – The Cable Car is Born By Kelley Trahan August 2, 2023, marks the 150th anniversary of the world’s first successful cable railway, born right here in San Francisco. To celebrate the occasion, we bring you the story of Andrew Hallidie and the very first cable car company, the Clay Street Hill Railroad.  Andrew Hallidie (1834-1900) was a pioneering inventor and entrepreneur who changed urban transportation. In 1852, at the age of 18, Hallidie emigrated with his father from the United Kingdom to San Francisco during the California Gold Rush. His father, an engineer and inventor, had a wire rope patent that played a crucial role in his son's future success.   Portrait of Andrew Smith Hallidie in 1890. Inspired by his father's wire rope business, Hallidie developed a steel cable mineral mine hauling system in 1857. About a decade later, he designed a wire rope aerial tramway for transporting materials over mountainous terrain. Then, after a stint in bridg...

Shared Spaces are Here to Stay. Permit Renewals are Due January 15, 2023.

Shared Spaces are Here to Stay. Permit Renewals are Due January 15, 2023. By Anne Yalon Shared Spaces, amongst many other benefits, allows our residents and families to enjoy safe and social outdoor dining. Seen here are the the owners of Tio Chilo’s Grill and their children in the restaurant’s parklet on 24th Street in the Mission.  San Francisco’s popular Shared Spaces program allows merchants, restaurants and arts and culture organizations to use the curbside, sidewalk and other public spaces to conduct local business activities and stay afloat. What emerged as an economic lifeline during the pandemic is making San Francisco’s streets more energized, engaged and activated. Many of the Shared Spaces parklets have become central gathering places for the local community. “ Our parklet makes me feel like when I go to Mexico, where outdoor seating is everywhere. People end up joining their friends in our parklet. It is a space for our customers and our community," said Liz V...

Tenderloin Streets Transform During COVID-19

Tenderloin Streets Transform During COVID-19 By Kimberly Leung COVID-19 has disproportionately impacted people who live and work in the Tenderloin. As a result, the SFMTA has been working closely with District 6 Supervisor Matt Haney’s office, other city departments, the Tenderloin Traffic Safety Task Force and community members to address the public health issues and unique challenges in the neighborhood through innovative interventions.    The Tenderloin is home to many of our most vulnerable communities including historically marginalized groups such as people with disabilities, residents of SROs and supportive housing and limited-English proficient communities. With every single street in the Tenderloin on the city’s High Injury Network -- the 13 percent of San Francisco streets that account for 75 percent of severe traffic injury collision and fatalities -- thi...